
VOICE Home Page: http://www.os2voice.org
[Newsletter Index]
[Previous Page] [Next Page]
[Feature Index]
|
VOICE Home Page: http://www.os2voice.org |
February 2002
[Newsletter Index]
|
| By Manfred Agne © February 2002 |
Recently, I discovered that my favourite commercial OS/2 application, Xact,
has never been reviewed in any VOICE newsletter! This may be due to the fact that
the current version (7.0) is the first version after many years that is also available
in English. The last English version before that was 3.2, which went GA in 1994.
Versions 4 to 6 were only available in German.
I became interested in Xact in 1994, when I was working on my PhD thesis. At
the time, version 3.2 was out, and although the price was pretty tough for me, I
went for the student version. It came in a big box, with a brief manual, a photocopied
sheet saying that the extensive manual formerly delivered had been abandoned because
nobody read it anyway, and a few 3.5" floppy disks - three, if I remember correctly.
Over the years, I went through versions 4, 5, and 6, and upgraded from the student
version to the full version. I'll explain why:
Xact imports data in the most common file formats - from CSV (comma separated
value) files and several other spreadsheet formats (ASCII, DIF, WKS, WK1, WK3, XLF
and DBF), the data are read into a "table". If there are too many data
points, it is also possible to perform automatic data reduction during data import.
Then, you will usually perform some operations in the table, define various columns
as "X-", "Y-", or "Z-data", and select the plot to
be generated. The plot can either be a graphical representation, or it can again
be a table - if you are doing TEX, this is probably the most convenient way to generate
a LATEX table! The available choice of data graphs seems to cover even the most
extravagant wishes. There are 12 categories (Line, Ribbon, Bar, and Pie charts,
Tables, Stock charts, 3D-Line, Contour , Surface , Profile, Special, and Polar plots)
with a total of 79 graphs, each having further options. After selection of the appropriate
options, Xact draws the graph as a vector graphic which can be scaled and modified
in a number of ways. For example, a double-click on any part of the graph will usually
pop-up a settings notebook with a wealth of options - colors, fonts, linewidth,
visibility, scaling, almost everything can be modified. However, even the default
settings usually create a quite nice and usable graph, so there's no need to get
too involved, unless you want to. The result can then be saved in Xact's internal
vector graphics format, or it can be exported in the most commonly used vector graphics
formats (including EPS, MET and WMF). If desired, Xact also exports the result to
bitmap format files (BMP, TIF, and PCX).
Currently, Xact is available for OS/2, 16-bit Windows, and 32-bit Windows. There
are demo versions of the three products in German
and English available at http://www.scilab.de, along with a 170 page PDF
manual which is compatible with Acrobat Reader 3 for OS/2. On OS/2, the Win9x version
requires ODIN, but if this is installed, all three versions of Xact install and
run (and uninstall) just fine on Warp and eCS. Not that I would see much reason
to try this - the OS/2 version has the same functionality as the Win-based versions,
and the data format is the same across all platforms.
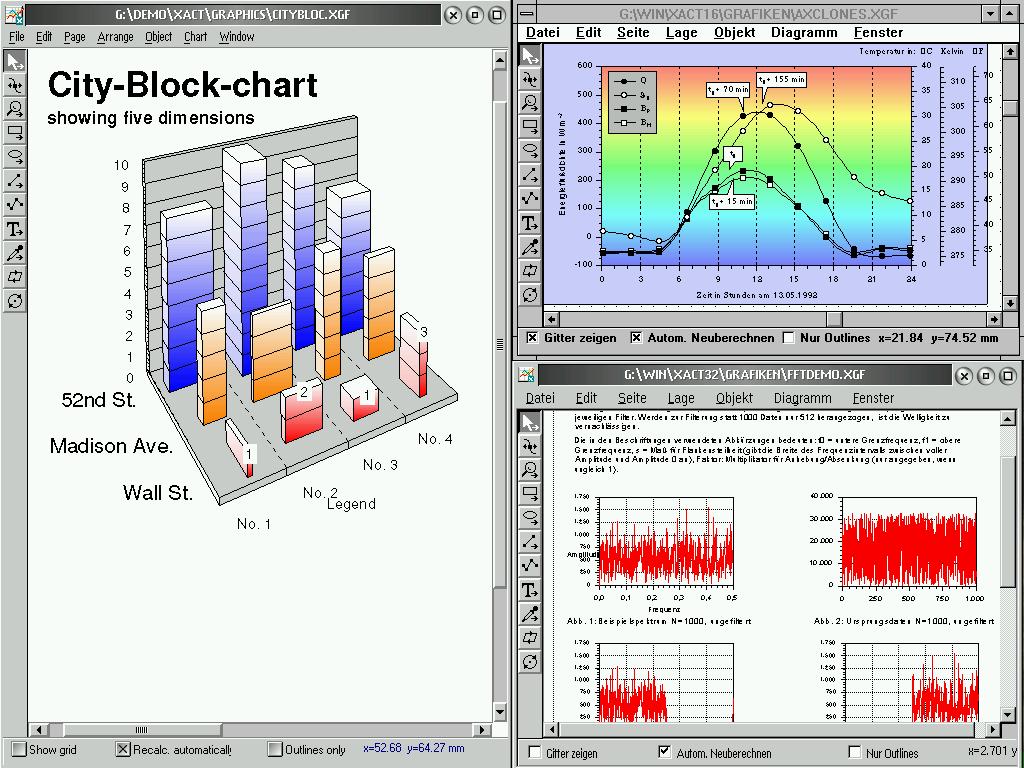 Note that the bottom right
window on the screenshot shows the Win9x version - my ODIN installation is configured
to use the OS/2 window buttons rather than the Win style buttons. However, you can
tell that it is the Win version by comparing the checkboxes in the lower part of
the window to those in the left window, which is the native OS/2 program running
under eComStation.
Note that the bottom right
window on the screenshot shows the Win9x version - my ODIN installation is configured
to use the OS/2 window buttons rather than the Win style buttons. However, you can
tell that it is the Win version by comparing the checkboxes in the lower part of
the window to those in the left window, which is the native OS/2 program running
under eComStation.
Xact also has a pretty good and well-documented REXX interface. It doesn't have
the tools to modify or add to Xact's own GUI, but all the charting and drawing tools
seem to be available via REXX, and Xact comes with some examples. It is also possible
to have Xact generate a bitmap image from the output. Therefore, you could probably
use Xact's REXX interface to periodically generate and update a dataplot for a website
- the monthly sales figures, the seismographic data from the volcano in your backyard,
or a scatter plot from your latest proton-antiproton collision experiment ;-) You
name it, Xact does it.
The vertical button bar on the left has the drawing tools; as indicated by the
small arrows, most buttons have further buttons attached to them which can be accessed
by clicking on the button, and dragging to the right while keeping the left mouse
button pressed. For example, the line drawing button has three further buttons,
for horizontal lines, vertical lines, and a "free hand" drawing tool,
which generates a polygonal line. It is possible to activate a "magnetic grid"
with a user-defined distance between grid points; objects can be positioned and/or
scaled by entering numerical values or by dragging with the mouse. There is also
a very useful "multiple clone" menu entry (under edit; you need to have
an object selected) which can be used to repeat the selected object on the same
page (eg. if you need to print your own address label 60 times on the same pre-perforated
self adhesive sheet). Using the same menu entry, but with different options selected,
it is also possible to repeat the same object rotated, scaled, and/or color-modified.
Xact is pretty fast, therefore even an older computer can handle hundreds of graphics
objects in a single file, without noticeable performance drop. Besides the vector
drawing tools, Xact also imports bitmaps. They can be scaled independently in x-
and y-direction, and they can be combined with the vector drawings. Unfortunately,
it is still not possible to rotate bitmaps by arbitrary angles (90°, 180°,
and 270° works), and transparency in pixel images is not supported. Either you
have a bitmap, or you don't have it. I found that it is possible to work around
these limitations by doing part of the work in Xact, export the result as a high-resolution
bitmap, and complete the project in ImpOS or Embellish.
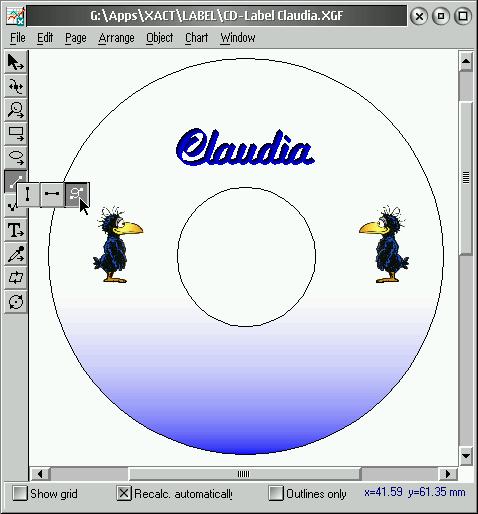
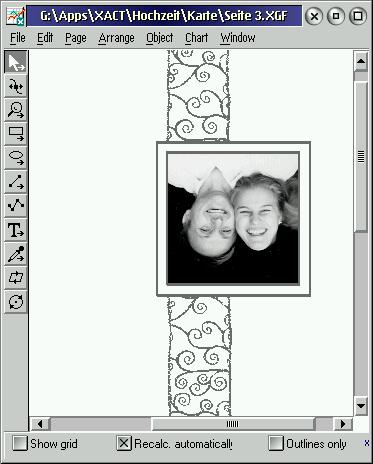
In most cases, however, Xact has all the capabilities that I need. For example,
I draw my floppy and CD-ROM labels and inlays with Xact. I use it to print address
labels and visiting cards. When I print photos on glossy ink jet paper, I use it
to arrange and scale the images. I also used Xact to generate the invitations to
my wedding and to print the menu, the address labels, and the program for the day.
Overall, I'm pretty satisfied with Xact. Probably the best value for money that
I ever received in a software purchase.
One more thing: If you buy Xact or Xact Pro, you will receive a CD-ROM with the
versions for OS/2, Win16 and Win32. Make sure the people from SciLab know that you
want the OS/2 version - they cannot possibly know which version you run, unless
you tell them!
References:
Xact 7.0 |
[Feature Index]
editor@os2voice.org
[Previous Page] [Newsletter Index] [Next Page]
VOICE Home Page: http://www.os2voice.org