


 Feature articles

Active GUI element
Static GUI element
Code
WPS object
File/Path
Command line
Entry-field content
[Key combination]
Using Theseus to Study Memory Usage Under OS/2
Part 1
Content
Most OS/2 users probably have suffered from memory-related problems, even if they don't know it. With some knowledge of the mechanisms at work, the comprehensive tool Theseus from IBM can help investigate such matters and find possible culprits and solutions.
Running out of memory with 1 GiB of RAM free
A common lament about OS/2 is as follows: I have 2 GiB of RAM but I cannot fully make use of it. When loading the big programs I get “out of memory” errors, even with 1 GiB of RAM free.
I have found tricks to increase the use of system memory (large JFS cache, giving XP 1 GiB in VPC), but I could not give 1 GiB of real RAM to user programs. I offered the big programs high memory arenas so lack of virtual memory should not be the problem.
I experimented a lot. The basic method was to load as many applications as possible using different CONFIG.SYS settings. To make situations comparable I used a folder with shadows of often used files, folders and program objects. I used a separate folder, as putting the applications in the startup folder or STARTUP.CMD could give an unstable OS/2 system.
So I loaded them by hand, got a shell and took a Theseus memory snapshot of it.
rem Theseus_Memory_Snapshot.cmd
cd cd Theseus
getram.exe 1 0 file c:\theseus.txt
type c:\config.sys >> c:\theseus.txt
call getlinmp.cmd >> c:\theseus.txt
start fte c:\theseus.txt
exit
To my surprise I found that using THREADS=1024 or higher had a negative impact on the amount of
programs I could start. In fact the THREADS needed when the system became unstable were less then 350. So I reduced
them to 400.
I had similar experiences when using a large VIRTUALDRESSLIMIT (VAL) in the
CONFIG.SYS: a VAL of 2048 or more may be good for some servers, but 1024 to 1536 should be better for a
WPS
user. It kept me going longer. Odin-ized programs do not need the Windows VAL of 2048. Only MS Office demands it, but
I use OpenOffice.org.
The most astonishing finding was that I could give user programs at most some 500-700 MiB of RAM. Loading more programs or letting them in time grow made the system unstable. Unless they were Java programs using mainly private memory.
The objective of my loading tests was to see if OS/2 can hold its virtual memory promises. Well, it did not because Theseus always found a lack of usable virtual memory space in the Shared Arena.
But who or what is Theseus? What kind of memory did the applications lack? And how do you measure virtual memory space in the shared arena? You find out by using Theseus.
Theseus
The Theseus from the Greek mythology was a legendary king of Athens. He was a son of the sea god Poseidon who killed the Minotaur in the Labyrinth of Creta. You can read all about it in the Wiki Encyclopedia.
But the Theseus written by IBM engineers deciphers the labyrinth of OS/2's memory usage. And indeed you must be prepared to use it. Otherwise you will drown in the seas of real and virtual memory.
Theseus is IBM's OS/2 Memory Analysis Program. Several versions can be found in the Hobbes mirror of OS/2 Site Australia. Choose the version that fits your OS/2 system. In older OS/2 versions, Theseus may need a device driver to get access to the OS/2 internals.
Theseus Process Hierarchy
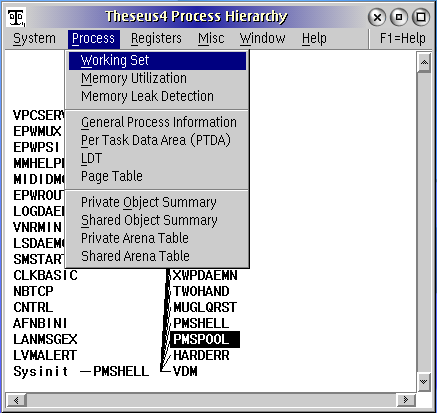
Figure 1. Theseus process hierarchy
The program starts by displaying the Theseus Process Hierarchy.
It shows the OS/2 process tree from sysinit reading and executing the CONFIG.SYS to the child processes initialized via the protected mode shell (protshell, in this case PMShell).
If you double-click on one of the processes, you get its General Process Information: PTDA, Threads, Exit list, Open files, Environment, the program and its parameters.
When you select a process in the Theseus Process Hierarchy, you can ask for more specific process information under the menu item Process: Working set, Memory Utilization, Memory Leak Detection, General Process Information, PTDA, LDT, Page Table, Private Object Summary, Shared Object Summary, Private Arena Table and Shared Arena Table.
Theseus gives probably more information about the OS/2 memory labyrinth then you ever wanted to know. But if you wish to study the OS/2 dynamics, Theseus with its excellent Help files (Help > Explanation of the contents of this window) is the way to go.
I will explain some useful options.
Working set determination
The working set of a program (Delta) is the amount of address space that a program uses in a certain amount of time. Because virtual memory must be presented to the processor as physical memory, programs that have small working sets are executed faster than programs that access a lot of virtual memory (EXE code, DLLs, data) in the same period of time.
Ideally the working set of a program should fit into the processor cache and the working set of the whole system (kernel + many active applications) should fit into RAM. The basic idea of pre-emptive multitasking is that the processor can only be optimally used when there is always some background task (thread) ready to accept processor time, while other threads wait for I/O operations (“Press a key”). But the working sets (the immediately needed code and data) of those background programs must of course be in RAM.
In the worst case the working sets of running programs are much larger than main memory, so that OS/2 immediately has to retrieve memory from the hard disk every time another process gets processor time. This leads to disk thrashing: the system being more involved with swapping memory than with running programs.
Theseus can measure the working set of a separate process and that of the whole system. With Theseus you can measure the actual memory usage yourself in your own situations.
To measure the working set of process, select the process in the Theseus Process Hierarchy, choose Process > Working Set and start the measurements with Functions > Working Set Start from the menu options.
Now do your things in the process (here importing this text and do some typing in OpenOffice.org 1.1.5). Then stop the sampling with Functions > Working Set Stop.
The output (Output > Save as) looks like this:
Working Set for the Process with PID = 009C, name = 'SOFFICE':
Use the 'Functions' pull-down or the 'Popup Menu'
  to start and stop the data collection.
Collection started: interval = 5, Working Set is 12 intervals.
current time ------ Process -------   ------ System DLL -----
hh:mm:ss.tt     now      ws   acc'd       now      ws   acc'd
22:59:25.52   8.199M  8.199M  8.199M    4.422M  4.422M  4.422M
22:59:30.40   3.508M  8.969M  8.969M    3.172M  4.605M  4.605M
22:59:35.40   2.613M  9.004M  9.004M    2.531M  4.633M  4.633M
22:59:40.39   2.289M  9.008M  9.008M    2.156M  4.633M  4.633M
22:59:45.40   2.621M  9.035M  9.035M    2.961M  4.680M  4.680M
5 samples collected.
                                 Process      DLL    Total
Absolute minimum amount of memory: 8.199M   4.422M  12.621M
Recommended amount of memory:      9.035M   4.680M  13.715M
Total amount of accessed memory:   9.035M   4.680M  13.715M
In this case I need 13.7 MiB (Recommended amount of memory) of RAM to import my “Using Theseus” file in OpenOffice.org Writer and do some editing. The Absolute minimum amount of memory of 12.6 MiB needed by OpenOffice would give some swapping.
According to Memory Utilization (which measures use of low virtual memory) the low virtual memory allocated (promised) to SOFFICE was 161 MiB of which 30 MiB was committed. So on a memory constrained system at least half of the committed memory would have been in the SWAPPER.DAT and 131 MiB of the allocated virtual memory would not have been used at all. At least not during this job.
The AE editor had a smaller working set (5 MiB) and dropped to 2 MiB memory after the import. But small programs do not necessarily have lower working sets than big ones. Java servers allocating huge amounts of virtual memory can have small working sets when they do their core business in a clever way.
The feature rich Workplace Shell (PMShell) has a relatively small working set (1-2 MiB accessed now) compared to its potential, as long as you do not quickly open all its folders or run checkini. Checkini accesses the WPS DLLs in a short period of time:
current time ------ Process -------   ------ System DLL -----
hh:mm:ss.tt     now      ws   acc'd       now      ws   acc'd
23:39:21.34   2.840M 22.414M 26.184M    3.211M  7.813M 16.051M
23:39:26.34   3.262M 22.277M 26.660M    2.539M  7.844M 16.117M
23:39:31.33   1.852M 13.773M 26.664M    2.145M  7.188M 16.117M
The selected process has terminated.
Periodic update stopped.
23 samples collected.
                                 Process      DLL    Total
Absolute minimum amount of memory:11.730M   8.012M  14.953M
Recommended amount of memory:     22.719M  12.219M  31.898M
Total amount of accessed memory:  26.664M  16.117M  42.781M
This WPS ran on an eCS system with 128 MiB of RAM. In Theseus > Process > Memory Usage 71 MiB was allocated and 24 MiB was committed. But only 10 MiB was in RAM. During checkini /C the allocated memory grew up to 87 MiB, of which 35 MiB was committed and 15 was in RAM. The SWAPPER.DAT was not used, so 20 MiB of the committed memory must have been derived from other owners. Shared memory from XWP daemon and the first PMShell (PM) might be candidates. But there might be other explanations as Memory Usage does not measure high memory.
Anyway, the lesson is that the working set of big processes can be kept low, as long as you do not need all their features in a short period of time. For this reason excessive use of virtual memory is by itself not a problem. OS/2 won't slow down as most allocated memory is not even committed. And only a small part of the committed virtual memory needs to be in RAM. This is the working set. The rest of the committed memory could rest on the hard disk.
The paging algorithms always try to keep the working sets of the active programs in memory. And as long as the working set of the whole system (Theseus > System > Working Set) fits in memory, programs run well until their steady state changes.
When you launch a new program or change the foreground program, the new foreground program gets a larger working set at the expense of others. In fact any action (mouse click) may cause some rearrangements in the virtual memory mappings of processes in RAM, but settles again to a steady state. But you notice changes in the working set more easily on memory restricted systems with an active SWAPPER.DAT than on modern computers with plenty of RAM. The latter only show virtual memory allocation problems.
Memory Utilization
Theseus > Process > Memory Utilization tells you what kind of memory resources an OS/2 program uses. It concentrates on “classic” OS/2 2 v4.x virtual memory usage. But this is not a disadvantage, as it is in the lower virtual memory arena's occupied by all 16 and most 32 bit programs and DLLs (virtual address space < 512 MiB) where the really problematic loading problems arise.
Under Misc > Content update choose Start Periodic Update. Then set the update time under Misc > Content Update > Options. Opening two Memory Utilization windows for the same process and starting Periodic update in one of them, enables you to see the growth or decrease in memory usage in time of each process. Now, what do you see and what does it mean?
To get an overview first look at the definition rows at the top and the summary rows at the bottom. What is the memory utilization of Seamonkey?
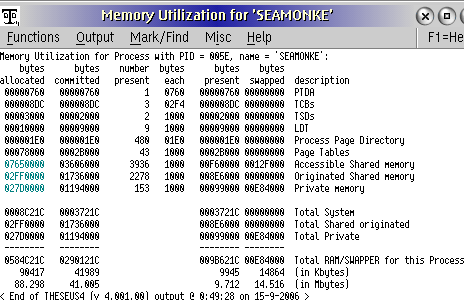
Figure 2. Memory utilization in Seamonkey
Bytes allocated is the amount of low virtual memory that the virtual memory manager promised the program after its memory requests.
The allocated memory in the first 512 MiB of address space was 88.298 MiB for Seamonkey that was only up for a short period of time. But you can expect it to grow enormously (> 200 MiB).
Allocated virtual memory addresses that were “touched” during the runtime of the process had to be made available in physical memory. So they got an entry in the Page Table that maps the virtual memory addresses to physical memory addresses (Memory committed = 41.005 MiB). And because the program may access these virtual addresses again, the Virtual Page Table must keep track of them until the program frees the virtual memory, or is closed.
Recently committed memory could still be in RAM (Bytes present = 9.712 MiB). This should contain the working set of the program. But the 4 KiB frames of the committed memory that were least recently used, could be “swapped” to disk (Bytes swapped = 14.516 MiB) to free physical memory for other applications. Some small memory objects could even be kept in compressed form in the system area (the “in memory” swap file): Keeping some not acutely needed bytes of memory in a 4 KiB page frame or in the SWAPPER.DAT is not efficient. See Swapper to see what I mean.
The decimal Number present is the amount of memory objects the program used in RAM. The hexadecimal Bytes each is the size of it. The often found 0x1000 bytes is the size of a page frame (4096 Bytes or 4 KiB). In the Description you can find where it was used (memory type).
If you want a quick orientation about the programs actual (in RAM) use of low private and shared memory, look at the decimal number of present page frames.
You can click on the green hexadecimal amounts. This gives you a pop-up window with a detailed description of private and shared virtual memory objects allocated and their total counts in MiB. In the details window you can click on an green hexadecimal address to get another pop-up window that shows you 100 bytes of its memory contents. Mostly, only a fraction of the allocated virtual memory is present in RAM.
Note that linear addresses above 1FFF FFFF are not displayed in Memory utilization. If you want to know more about high memory usage, you can go to Process > Private and Shared Object Summaries or System > Linear usage by process.
Measuring the Memory Utilization of the Workplace Shell
Now have a look at the WPS of an eCS 1.2 system with 128 MiB of RAM after doing some work and loading enough
applications to let the SWAPPER.DAT grow to some 30 MiB with the lazy
MEMMAN=SWAP,PROTECT.
Memory Utilization for Process with PID = 002A, name = 'PMSHELL':
    bytes      bytes    number  bytes      bytes    bytes
allocated  committed   present   each    present  swapped  description
 00000760   00000760         1   0760   00000760 00000000  PTDA
 000090B4   000090B4        49   02F4   000090B4 00000000  TCBs
 00031000   00030000        42   1000   0002A000 00006000  TSDs
 00010000   00009000         9   1000   00009000 00000000  LDT
 000001E0   000001E0       480   01E0   000001E0 00000000  Process Page Directory
 00078000   0002C000        44   1000   0002C000 00000000  Page Tables
 07310000   02C89000      3712   1000   00E80000 0042C000  Accessible Shared memory
 03270000   014DD000      1679   1000   0068F000 002EC000  Originated Shared memory
 023A0000   00B4A000       759   1000   002F7000 001E5000  Private memory
 000C29F4   0006E9F4                    000689F4 00006000  Total System
 03270000   014DD000                    0068F000 002EC000  Total Shared originated
 023A0000   00B4A000                    002F7000 001E5000  Total Private
 --------   --------                    -------- --------
 056D29F4   020959F4                    009EE9F4 004D7000  Total RAM/SWAPPER for this Process
    88906      33366                       10170     4956  (in Kbytes)
   86.823     32.585                       9.933    4.840  (in Mbytes)
The last line tells us that 86.823 MiB of virtual memory was allocated (promised) to the Workplace Shell, 32.585 MiB of it was touched (and thus “lazily” committed), 9.933 MiB of the committed memory was still in memory and 4.840 MiB was already swapped out. The rest of the committed memory could have already have been discarded or kept in the compressed SWAPPER.DAT in system RAM. I'm not sure about this.
Just for comparison: the unused PM Spooler got 29 MiB of virtual memory allocated, but needed only 141 KiB in RAM and had 592 KiB swapped. Its working set was minimal. But it could accept a printing command.
The Virtual Memory Picture of a Process
As you can see the virtual memory picture of a process is made up of several components: system, private, and shared.
The first entries concern System RAM: The Per Task Data Area (PTDA), Thread Control Block (TCB), Thread Swappable Data (TSD), Local Descriptor Table (LDT), Process Page Directory, and Page Tables. They are called RAM because they are resident: preferably in RAM, but some tables could be swapped to disk. They are needed by the processor and operating system for elementary functions like task switching.
The EXE file is part of the program's private memory, that part of its virtual memory that it does not share. If you click on the green Hex[adecimal] address, you can see which DLLs were used for that. You see that many shared system DLLs can also be used (linked) privately.
The originated shared memory is the program's contribution to the shared arena. (If you don't like Hex, you can click on the green Hex address.) I was surprised to find that many DLLs did not originate from the program file's directory. In a Graphical User Interface (GUI) like Windows or OS/2 that is shared by many processes, process boundaries can really become blurred….
Of course, DLLs were meant for sharing. So the accessible shared memory, the total amount of shared memory which is really accessible by the process, is relevant. It includes: originated shared memory, DLLs used by the process, memory given to it by another process, and memory acquired (using DosGetSharedMem).
But if you compare the originated shared memory with the accessible shared memory of a detached process like CNTRL.EXE, you may be surprised that they hardly differ. In fact CTRL shares memory with all kinds of DLLs that have nothing to do with its function: DIVE, INNOWIN, OOWIN, PSCRIPT, and FLASHWIN to mention a few. As CTRL.EXE does not show Flash multimedia content or does some graphical printing, they will never be committed.
These DLLs may have been offered to all applications because OS/2 programmers could not predict which programs would use them. But the unneeded linking of DLLs may have implications for the out of (virtual) memory errors OS/2 users now often get.
-
Even though these shared but unneeded virtual memory addresses may never be committed, they still use system resources. Even unallocated virtual memory uses system resources that could be better used for more processes, a bigger shared arena, more threads, a higher VAL per process, or a bigger JFS cache.
-
But what I mostly fear is that they allocate exclusive memory objects (addresses) in the sparse shared arena.
-
Programmers who compile programs using high memory lets OS/2 load their DLLs in the high arena, but they cannot force associated Presentation Manager and WPS DLLs to load high (reallocate) the virtual memory that is automatically associated with them.
-
So even 32 bit OS/2 programs that have been optimally compiled for the virtual high arenas still have a legacy tail in the low arena shared with their 16/32 bit peer PM processes, even if they do not seem to need the 16 bit addresses associated with them to do their job.
SET RUNWORKPLACE= and protected mode shell (PROTSHELL=). Many DLLs that are not required for your
core business are not loaded.Functions
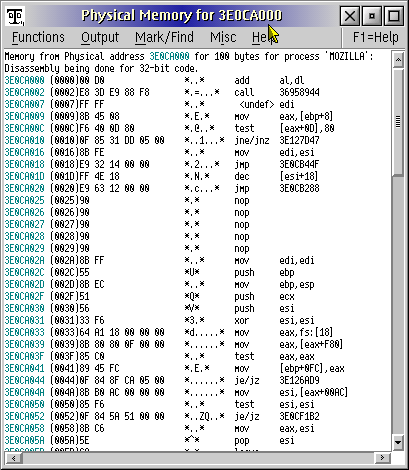
Figure 3. Example display of disassembled physical memory for Mozilla
The Theseus hypertext Functions enable you to dive deeper and deeper in every process. You can even disassemble code with it.
When you see a green memory address you can query its functions. Just select it and choose for Functions.
The display options are:
-
Show memory at linear address in hex
-
Show segment at virtual address in hex
-
Show memory at physical address in hex
-
Show selected address formatted
Under Misc > Double click options you can set how the first 100 bytes are formatted: In bytes, words, double-words, or even disassembled.
In this case you see Mozilla using physical address 3E0C A000 (around 993 MiB) in disassembled code.
Converting hexadecimal to decimal addresses by using the clipboard
If you want to convert a hexadecimal address, say 3E0C A000, to a decimal address, or vice versa, you can use the Windows Calculator or eCS Calculator to do it. You must use them in scientific mode.
Just copy the Theseus hexadecimal notation to the clipboard with Mark > Find > Copy selection to clipboard and paste it in the Calculator whilst it is in Hexadecimal mode. The options are Hex, Oct, Dec; and Bin. After importing the hex address 3E0C A000 change the calculator mode to Decimal. You then get the bytes notation (1,041,014,784).
To go to kibibytes (KiB, called kilobytes (KiB) by OS/2, but in SI terms only 1,000 bytes) divide them by 1024 and to go to mebibyte (MiB, by OS/2 called megabytes (MiB), but 1,000,000 bytes according to the SI notation) divide them twice through 1024 to get what OS/2 calls megabytes.
See also the Wiki about Megabyte.
By the way, using the clipboard is a typical case of sharing memory. Because 16 bit applications must use the clipboard too, clipboard contents must be in the shared arena of every process.
Odin-ized programs like Acrobat 4 and OpenOffice.org have difficulties sharing clipboard contents in the low shared memory conditions they often create for themselves. They show process names like “SOFFICE.EXE (ClipboardWindow)”, “AROS2.EXE (transport Window)” in Watchcat when they hang.
Page Table
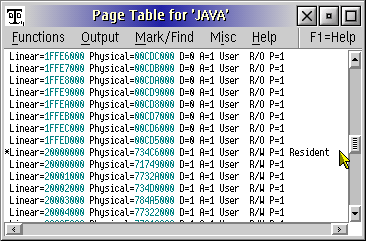
Figure 4. Page table for Java virtual memory usage
Under Process > Page Table you find the Virtual Page Table of the process. The Page Table translates the linear addresses of virtual memory to physical memory addresses in RAM. Programs using high memory have hex entries starting at linear address 2000 0000 (512 MiB) or higher. The linear addresses of programs using only the low memory arenas start with 0 or 1 with hexadecimal 1FFF FFFF being the upper limit.
So scroll down to hexadecimal 2000 0000 to check this. A very rough indicator of the ratio low memory / high memory usage is the position of the scroll handle at the right side of the Theseus window. In this case (Java) almost half of paged virtual memory addresses were above 512 MiB.
Local Descriptor Table (LDT)
The Intel 286 processor used special tables to keep track of the virtual memory of each process. Each protected mode process had a unique Local Descriptor Table (LDT) and the system as a whole used a Global Descriptor Table (GDT). The GDT also contained entries for shared memory. GDT and LDT entries that point to same memory were called aliases.
The local descriptor table of a program contained essential information about its virtual memory usage: addresses (segmented!), if it is writeable, in memory, etc. For the features just have a look in one of the tables and see Theseus context help.
32 bit OS/2 programs make use of the flat linear 0:32 addressing scheme of the Intel 386 processor. But 16 bit protected mode programs still expect to find 16 bit addresses in a LDT. So 32 bit OS/2 2.0 used the technique of 32 to 16 bit, thunking, to make sure that the linear 0:32 addresses of the Intel 386 also had full 16:16 selector:offset representatives in the LDT and GDT (LDT tiling). The limited capacity of the LDT played a role in OS/2's virtual address space limitation of 512 megabytes (8191*64 KiB). For this reason only virtual memory addresses below 512 MiB is tiled.
When a program allocates memory with the malloc() function, OS/2 places it in the first 512 MiB of virtual address space by default. Since the advent of the 4.5 kernels (1998), OS/2 can specifically compile programs (using DosAllocMem() with an OBJ_ANY flag) to access high memory arenas (HMA). But this virtual address space placed above 512 MiB (hex 2000 0000) cannot be shared by normal applications and is invisible to 16 bit DLLs and applications.
Private and Shared Object Summaries
When a process asks for new memory, OS/2 allocates it as a memory object with certain properties. It has a begin and end in virtual address space, often with a file connected to it, and it can be designated as shared or private. The addresses may be (partly) committed, in memory, or swapped out.
The Object Summaries are interesting because they also show virtual addresses in high memory (hex 2000 0000 and more). The earlier described Memory Utilization concentrates more on the tiled memory addresses (< 512 MiB) which are also visible in the LDT.
Under Process > Private Object Summary you see the memory objects of the selected process in the private arenas. I selected the small GSVDAEMN process used by APM.
Private Object Summary for 'GSVDAEMN':
  Object Allocated Committed   Present   Swapped
 address    memory    memory    memory    memory  Description
00010000  00010000  00001000  00001000  00000000  GSVDAEMN #0000 (shared data)
00020000  00010000  00003000  00003000  00000000  GSVDAEMN #0000 (private)
00030000  00010000  00002000  00002000  00000000  User Environment (hmte)
00040000  00010000  00001000  00001000  00000000  Thread Information Block (hmte)
00050000  00010000  00001000  00001000  00000000  stack (hmte [system owner])
00060000  03FA0000                                 Free
20000000  08000000                                 Free
          --------  --------  --------  --------
Totals:   00050000  00008000  00008000  00000000  (in bytes)
               320        32        32         0  (in Kbytes)
             0.313     0.032     0.032     0.000  (in Mbytes)
Number of objects = 5.
Analysis of 'Free' areas:
There are 2 free blocks which total 0BFA0000 (196224K or 191.625M)
The largest 2 free areas are:
 address      size
20000000  08000000 (131072K or 128.000M)
00060000  03FA0000 (65152K or 63.625M)
The low private arena starts at hex 0000 1000. It contains the EXE file, the user environment, thread information, the stack, and the low and high memory arenas. Bigger processes also contain private memory allocated to DLLs. The high private arena starts at hex 2000 0000 (512 MiB).
OS/2 reserves a minimum of 64 MiB of low private memory per process. Here another 128 MiB block was reserved in high virtual memory. But the “legacy” GSVDAEMN may not access it all.
Under Process > Shared Object Summary, you can see the program's shared arena. The allocated shared memory of GSVDAEMN.EXE is large. Even the tiniest OS/2 program shares (as allocated memory) the DLLs that resident OS/2 applications put in the shared arena. So the listing is long and I cannot show them all. But most shared code and data is not used at all (Committed memory: 0). In my selection only parts of the OS/2 System library DOSCALL1 are seem to be committed and in RAM.
Shared Object Summary for 'GSVDAEMN':
  Object Allocated Committed   Present   Swapped
 address    memory    memory    memory    memory  Description
08650000  0E0E0000                                 Free
16730000  00010000  00000000  00000000  00000000  PMCTLS   allocated it
16740000  000B0000  00000000  00000000  00000000  THESEUS4 allocated it
167F0000  00080000  00000000  00000000  00000000  PMMERGE  allocated it
16870000  00070000  00000000  00000000  00000000  PSCRIPT  #0001 (shared code)
...........not shown part of the lower shared arena.....................
1FFD0000  00010000  0000E000  0000E000  00000000  DOSCALL1 #0000 (shared data)
1FFE0000  00010000  0000E000  0000E000  00000000  DOSCALL1 #0000 (shared data)
1FFF0000  00010000                                 Free
31B70000  2C1F0000                                 Free
5DD60000  00080000  00000000  00000000  00000000  INNOWIN  allocated it
5DDE0000  00200000  00000000  00000000  00000000  INNOWIN  allocated it
5DFE0000  02000000  00000000  00000000  00000000  FT2LIB   allocated it
5FFE0000  00020000  00000000  00000000  00000000  DRIVER   #0000 (]
          --------  --------  --------  --------
Totals:   0BB50000  010A2000  009B7000  00000000  (in bytes)
            191808     17032      9948         0  (in Kbytes)
           187.313    16.633     9.715     0.000  (in Mbytes)
Number of objects = 1108.
Analysis of 'Free' areas:
There are 4 free blocks which total 3A2F0000 (953280K or 930.938M)
The largest 4 free areas are:
 address      size
31B70000  2C1F0000 (722880K or 705.938M)
08650000  0E0E0000 (230272K or 224.875M)
16B00000  00010000 (64K or 0.063M)
1FFF0000  00010000 (64K or 0.063M)
Here the low shared arena starts at 0865 0000 (134.31 MiB). The lower border depends on the size of biggest process in the low private arena. So the boundary between the private and shared arena is not fixed. As the shared arenas are “seen” by all processes, big processes like Mozilla show the same values as small ones like GSVDAEMN. The shared arena ends at 1FFF FFFF (512 MiB) per default.
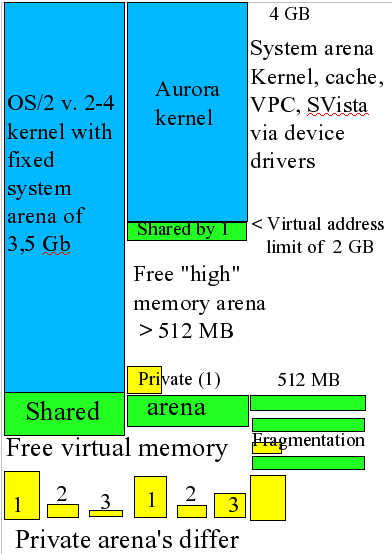
Figure 5. Comparison of memory arenas for old and new kernels with high memory support
The upper 32-64 MiB of the shared arena are reserved for protected system libraries (DOSCALL1, the SESMGR of Security/2). So the shared arena could maximally be 512 - 2*64 MiB = 384 MiB wide. But on desktop systems Presentation Manager and the Workplace Shell first fill the shared arena before your start your programs. So most freshly started OS/2 systems only have some 200-300 MiB of free (unallocated) shared memory available.
Using a network you may even have less. When I booted a fast (4 GHz) computer, the automatically started network programs temporarily allocated so much virtual memory in the shared arena while connecting, that the WPS failed to start up (deformed icons, no text). Postponing the “Net Use” commands or reducing the amount of threads helped.
The irony is that such fast virtual memory expansion was unlikely to happen on slower computers with limited RAM. Ten years ago I allowed (but never used) more then 2048 threads, but now I have to temper my programs virtual memory allocation vigor by reducing the amount of allowed threads and processes.
Processes may now have more real and virtual memory address space, but they should not use too much low virtual memory address space at the same time….
In the case above the largest free “block” in the low shared arena is 224.875 MiB (at 0865 0000), which is not bad. But this “block” may be fragmented as Linear usage by process often shows.
Other utilities may even give higher values for free virtual memory (address space) in the shared arena, especially when they measure small free memory objects. But these crumbs may be of little practical use when loading the large memory objects of memory hungry applications. Then “out of memory” errors occur.
Linear address space fragmentation easily occurs in the process of loading and unloading applications and their DLLs. The virtual address space may first behave like HPFS, but many virtual memory objects do not tolerate fragmentation. So after a while, maybe half an hour, maybe days, depending on the memory usage of your applications and your clicking behaviour, the larger blocks of free memory disappear and most OS/2 systems with plenty of RAM show loading errors because of fragmentation in the shared arena. Even if you free memory by closing as many applications as you can. Then it is time save your data and reboot.
In the high shared area that is not used by all processes there is 705.938 MiB free (at hex 31B7 0000). But it is unlikely that the legacy GSVDAEMN will ever use it. Even the for high memory usage compiled Mozilla brands mainly use it for the Innotek's Font cache and the from Windows derived Flash code.
But this is not the fault of the programmers. They use the flag OBJ_ANY in DosAllocateMem() or the linker option -Zhigh-mem in GCC to let OS/2 load their code and data high. But it depends on the memory situation if the OS/2 loader actually does so. Because the OS/2 system loader can load them anywhere….
The flag you want is
Note that this is more like a hint than a guarantee. It means that the OS will TRY to allocate the memory from the high memory area (HMA), but allocates it low if that's not possible. Also note that any memory (shared or not) that you allocate CANNOT be used with many APIs (anything that might need thunking to 16bit).
OS/2 kernel maintainer Scott E. Garfinkle (vr 20 nov 1998 00:00) on comp.os.os2.misc
Private and Shared Arena Tables
The Private and Arena Tables show more technical information. I skip the description as the Arena Tables are probably only understood by engineers and programmers (not me). I only have two remarks.
Memory objects with linear address space attached to it (records) can be accessed using a HAR. When using handles, you do not need to know the exact linear address.
Also note that in protected mode memory objects can have all kinds of “flags”: writable, readable, executable, data, or guarded to name some. Of course this is part of the mechanism of memory protection.
RAM usage by process
To have a global idea about the real memory consumption (private and shared) of your programs go to Theseus > System > RAM usage by Process.
What is measured is the amount of committed memory. Committed virtual memory is mapped to a physical memory address or stored temporarily in SWAPPER.DAT. For this reason it actually is not owned by the process but by the system.
Protected mode programs can only temporarily access their virtual addresses that are mapped to physical memory. This happens when OS/2 grants their threads some time-slices in the processor. While the code is executed, the processor keeps an eye on its virtual memory use. But in between (and certainly when the active Theseus measures it), the potential dangerous program code in RAM is solely owned by the system:
Memory from Physical address 7F97E000 for 100 bytes for process 'system':
Disassembly being done for 32-bit code.
7F97E000 (0000)00 83 EC 0C BA 8A *......* add [ebx+8ABA0CEC],al
7F97E006 (0006)00 00 *..* add [eax],al
7F97E008 (0008)00 E8 *..* add al,ch
7F97E00A (000A)42 *B* inc edx
7F97E00B (000B)00 00 *..* add [eax],al
7F97E00D (000D)00 83 C4 10 5E 5F *....^_* add [ebx+5F5E10C4],al
So if you click on the green addresses in RAM usage by process, you always end up with memory belonging to the system. Nethertheless in RAM usage by process Theseus measures the amount of committed memory that each process borrowed from the system.
In memory-restricted systems the amount of physical memory of each process should come close to its working set. But in memory-rich systems usable virtual address space restricts their growth. If you have 1 GiB of RAM free and there is not enough usable linear address space in the restricted shared arena, programs cannot commit new memory and stop functioning properly.
So keep an eye on programs that commit a lot of memory. Especially when they allocate it in the shared arena that many other programs also have to use.
Under Misc > Content update you can choose for Start Periodic Update. You can set the update time under Misc > Content Update > Options. We now keep an eye on the growing RAM usage of certain fast growing programs.
The growing Workplace Shell
The Workplace Shell grows as more WPS libraries and file system folders are accessed. When running Checkini my WPS grows from some 12 MiB to 35 MiB. Once accessed, code and information is kept in virtual memory, even if the WPS additions and the folders are closed again.
This is not a memory leak but a matter of design: The idea was that keeping DLLs in virtual memory was faster than loading and unloading them with every use. And reopening a folder with many objects would be faster if the folder contents were cached in virtual memory. On low physical memory systems (16 MiB was a power system in 1994), the unused virtual memory pages would soon be swapped out of virtual memory, so the user would not notice it.
But you may already encounter a lack of usable virtual memory addresses today when you have 128 MiB or more RAM installed. When shared memory resources are low or the shared arena is fragmented, the WPS may not reserve the virtual memory needed to function properly.
Then it is time to do a WPS reset (eCS > Restart WPS or [Ctrl-Alt-Delete] > Restart WPS) to minimize the virtual memory usage of the WPS again to its start up value.
If a freshly restarted WPS still loads too many DLLs into virtual memory, you should deregister unneeded WPS classes with their unneeded DLLs. Even the WPS classes of the IBM Global Network (AdvDialer, AdvUser, AdvAccount, AdvReg, and AdvCust) can still be found in eCS.
The Mozilla family
Programs of the Mozilla family (Mozilla, Firefox, Seamonkey, Thunderbird, NVU) ask a lot of virtual memory and much of it is kept in RAM. At startup, Mozilla already uses 18 MiB of virtual memory in RAM. And that is more than a freshly reset eCS WPS uses. But when you browse, Mozilla can grow to huge proportions.
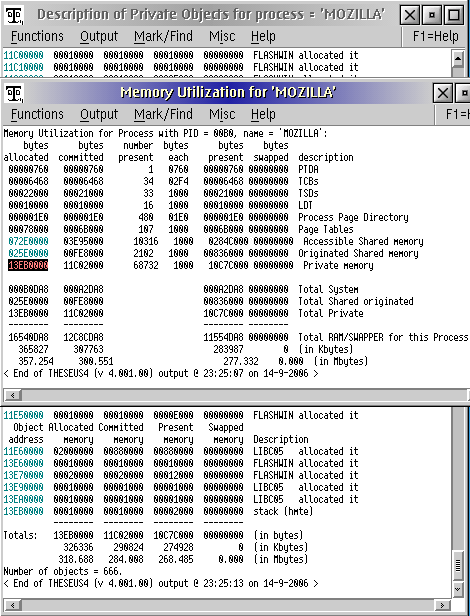
Figure 6. Memory utilization display for Mozilla using 300 MiB
Using Theseus > RAM Usage by Process I measured values of 300 MiB and more with Firefox.
But having 2 GiB shortage of RAM was not my problem. It would even not be a problem with 512 MiB because OS/2 could use the SWAPPER.DAT. The real danger is lack of virtual address space in the shared arena.
With values like this most of the program code and data should be private memory and preferably allocated in the high memory arenas (HMA). Indeed most code was private and a lot of it was loaded high. You can use System > Linear usage by process or Process > Private Object Summaries and Process > Shared Object Summaries to check this.
But Firefox also allocated at least 318 MiB of low private virtual memory as seen by Process > Memory Utilization. And remember that Memory Utilization measures the memory usage seen by all (16 and 32 bit) processes and DLLs. Addresses below 512 MiB (hex 2000 000).
Even if most memory was loaded privately, the “only” 10% (hex 025E 0000, 38 MiB) below 512 MiB allocated originated shared memory was on the order of my current WPS (45 MiB).
And the 13EB 0000 (318 MiB) low private memory usage was enough to practically reduce my shared arena to 512 - 318 = 194 MiB. Because the biggest process in the private arena determines the lower border of the shared arena. So allocating memory privately is not always harmless.
Now one can wonder why this was the case because the Mozilla porters do their best to load high as much code a possible.
-
Flash 7 plug-ins had entries in low shared virtual memory. Because cut and paste to 16 bits applications and even Win-OS/2 should also work, a pure high memory version of it seems unlikely. The same holds true of the clipboard as Andy Willis explained to me.
-
But also PM and WPS code (called legacy tail that was automagically loaded with the PM process Mozilla in my description of Memory Utilization) may have played a role. It may have been already shared code and data that did not impinge on the shared arena. But any program loading high must also have some reflections in the shared arena that is shared by other programs. They must at least be known to (and thus sharing memory with) the Presentation Manager which is not using high memory.
In the case of Mozilla I found that setting the memory and hard disk cache size to zero did not change its memory eating behaviour. Memory Leak Detection told me that Mozilla seldom deallocates memory.
Firefox and Seamonkey do the same. And also Thunderbird grows when you browse your newsgroups and mail servers. They grow and keep on growing until you close their EXE-files and start them up again.
Letting the Physical Memory Manager swap inactive code and data to disk is the normal behaviour of classic WPS and PM applications, but the Mozilla family swapped little RAM to disk. And again I wondered why.
Maybe it is sometimes caused by animated GIFs and Flash contents that scream for your attention and the continuous font rendering when you load pages. These interactive web pages use RAM and processor time even when they are not in your active Mozilla Tab or PM Center virtual screen. But then the excessive real and virtual memory usage should stop when you close the Windows with interactive content. But this is not the case. Processor use stops but the memory consumption only release when you close Mozilla. So it seems that Mozilla allocates but seldom deallocates memory.
And this is a major problem when you have 1 GiB of RAM and also want to load OpenOffice.org and other programs in the shared arena. Because when there is no addressable virtual memory space left, you see “out of (virtual) memory” errors and unexpected malfunction of other programs.
Thus ends the first part of the article about Theseus and also of our series about OS/2 and memory. Next month, we finish our tour of Theseus and take a look at memory leak detection, among other things.